Suburb Report for
Blaxland
NSW 2774
Whether you’re looking to buy, sell or rent, it’s important you’re in touch with what’s happening in Blaxland.
About McGrath Lower Blue Mountains
Since joining the McGrath family, our agency continues to enjoy growing successes for our clients, consistently achieving results well above market average, setting and breaking local results records and receiving multiple industry awards. We are thrilled that this has all been achieved while maintaining the honesty, integrity, personal service and down-to-earth approach that we are known for.
Market trends for Blaxland
View median property prices for Blaxland to get a better understanding of local market trends.
House For Sale
12 month rolling average
-
$312.5K
ENTRY
-
$1.2M
MEDIAN
-
$2.2M
HIGHEST
Unit For sale
12 month rolling average
-
$700K
ENTRY
-
$833.5K
MEDIAN
-
$955K
HIGHEST
House Rental Data
12 month rolling average
-
Median Rental Price
$700/w
-
Rental Yield
3.03%
-
Leased Rentals
55
Unit Rental Data
12 month rolling average
-
Median Rental Price
$475/w
-
Rental Yield
2.96%
-
Leased Rentals
20
powered by

Blaxland stats
Explore key metrics on property trends, demographics, and lifestyle factors defining this suburb. All market transactions.
38
Average Days on Market
Calculated from the latest market transactions119
Total Sales Last 12 Months in Blaxland
$1.2M
Average Sale Price in Blaxland
6.7%
Suburb Growth
12 month rolling averageLatest McGrath Market Activity
Discover the latest insights on property transactions, price movements, and demand trends.
31
Average Days on Market with McGrath
89
Total McGrath sales in the last 12 months
$1M
Average Sale Price with McGrath
1434
Buyers Met
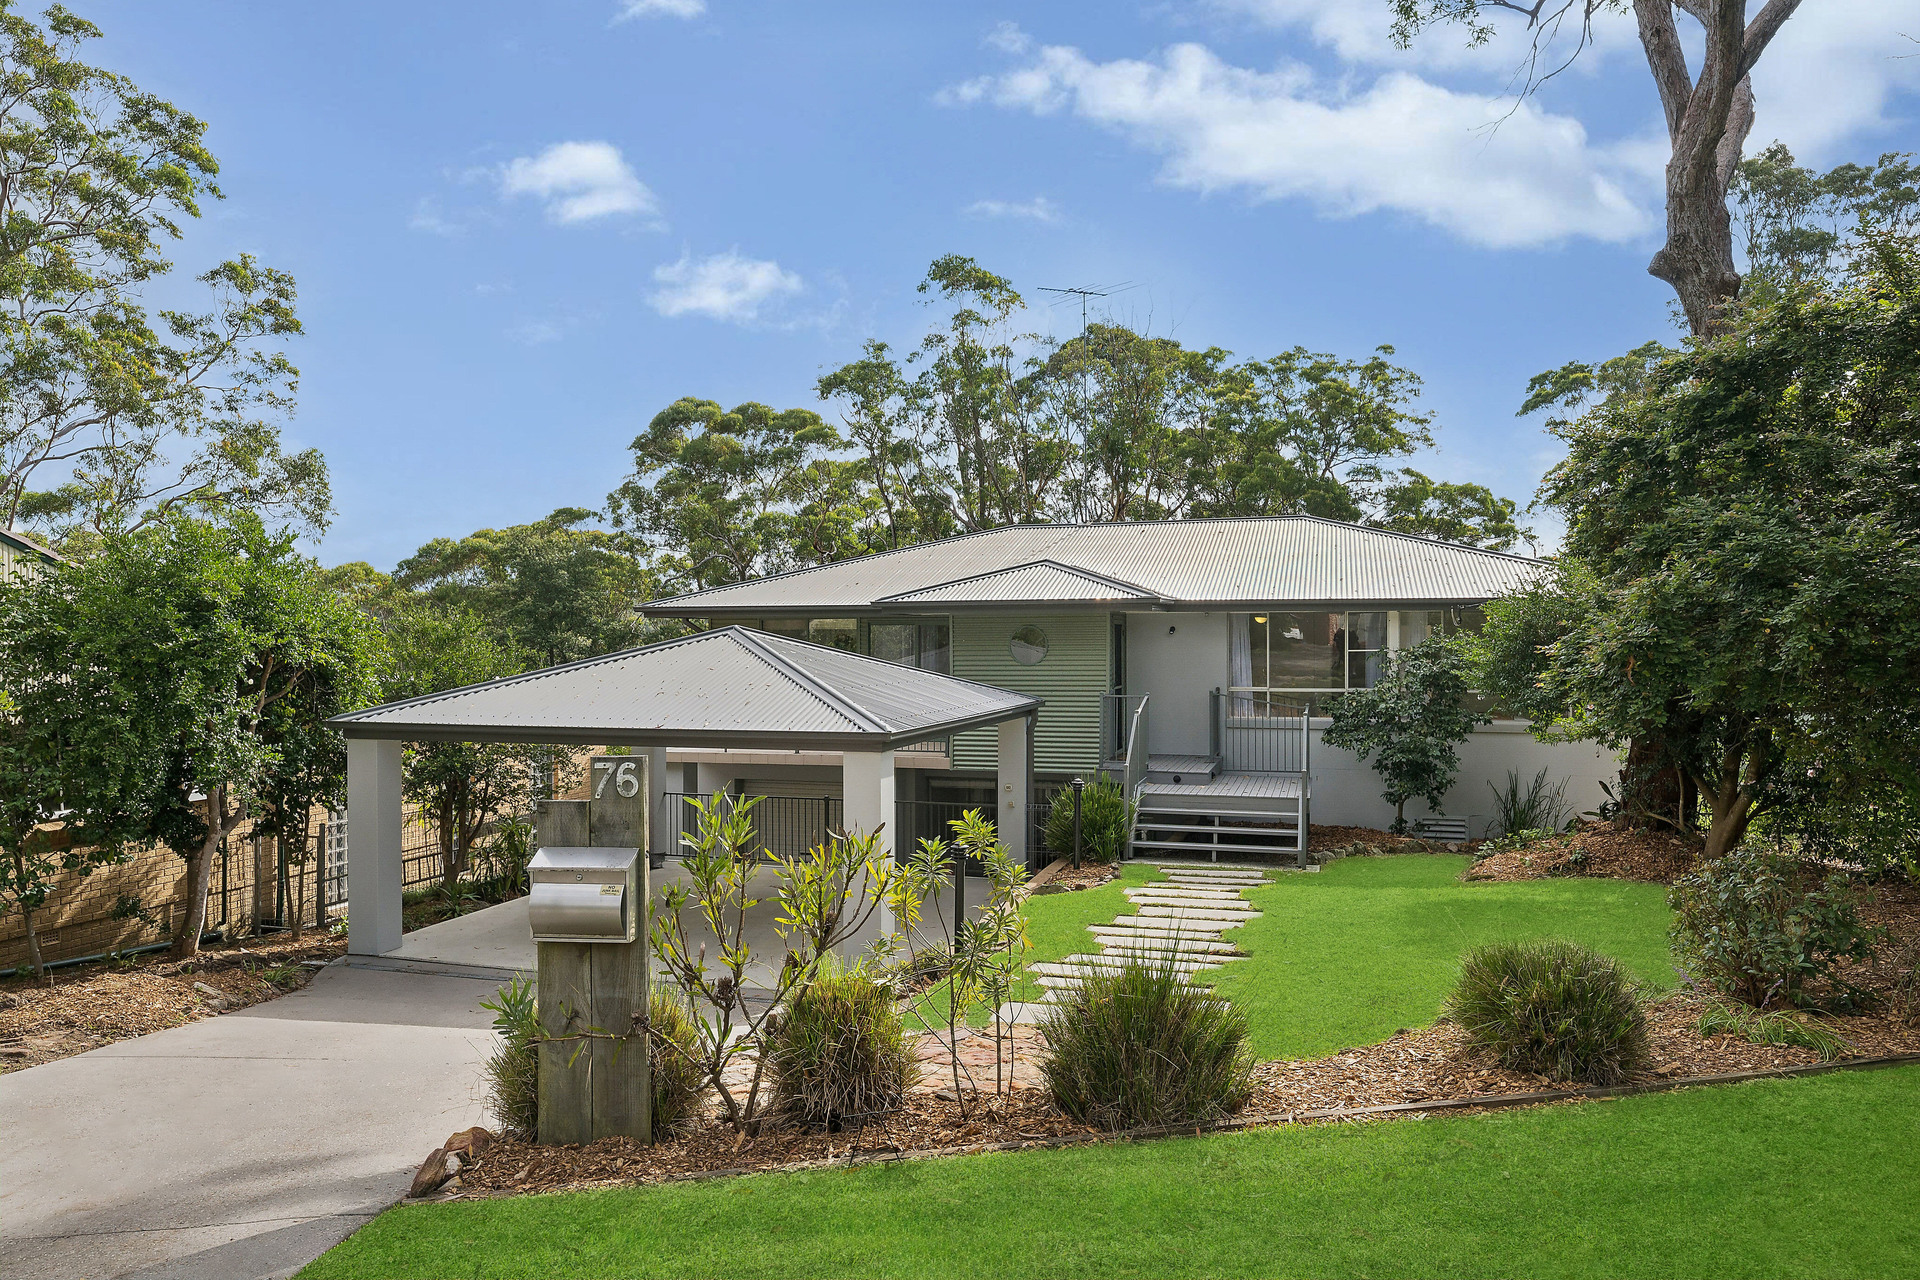
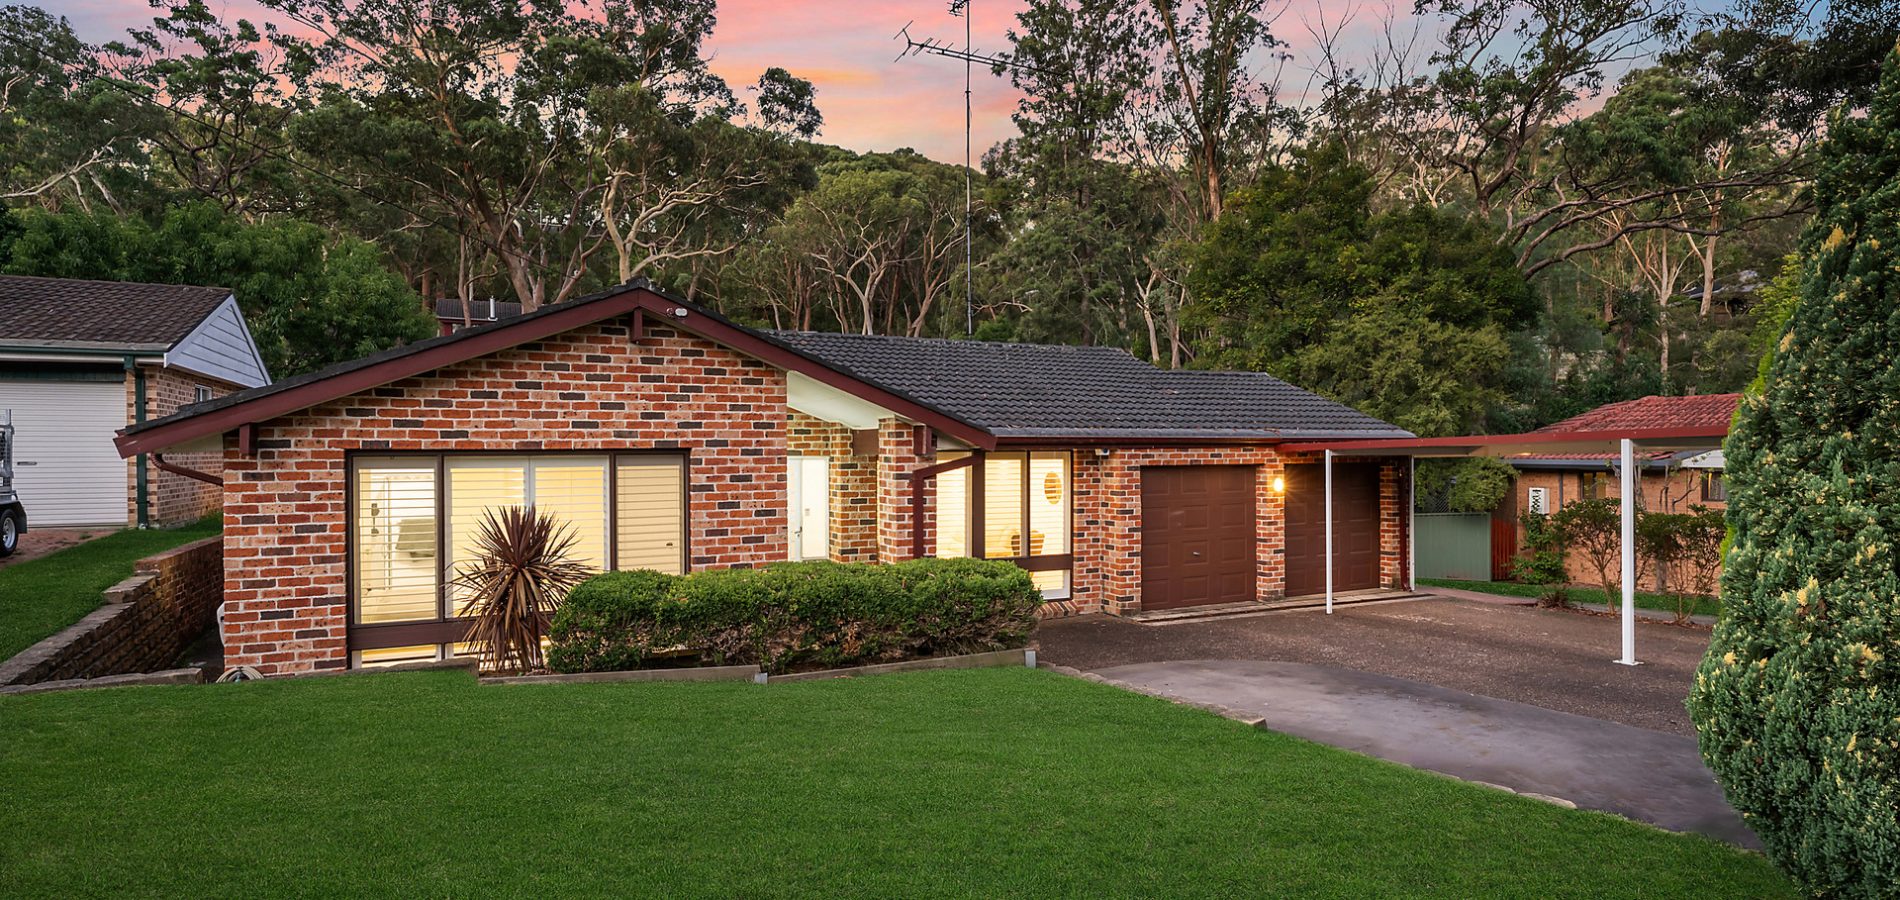
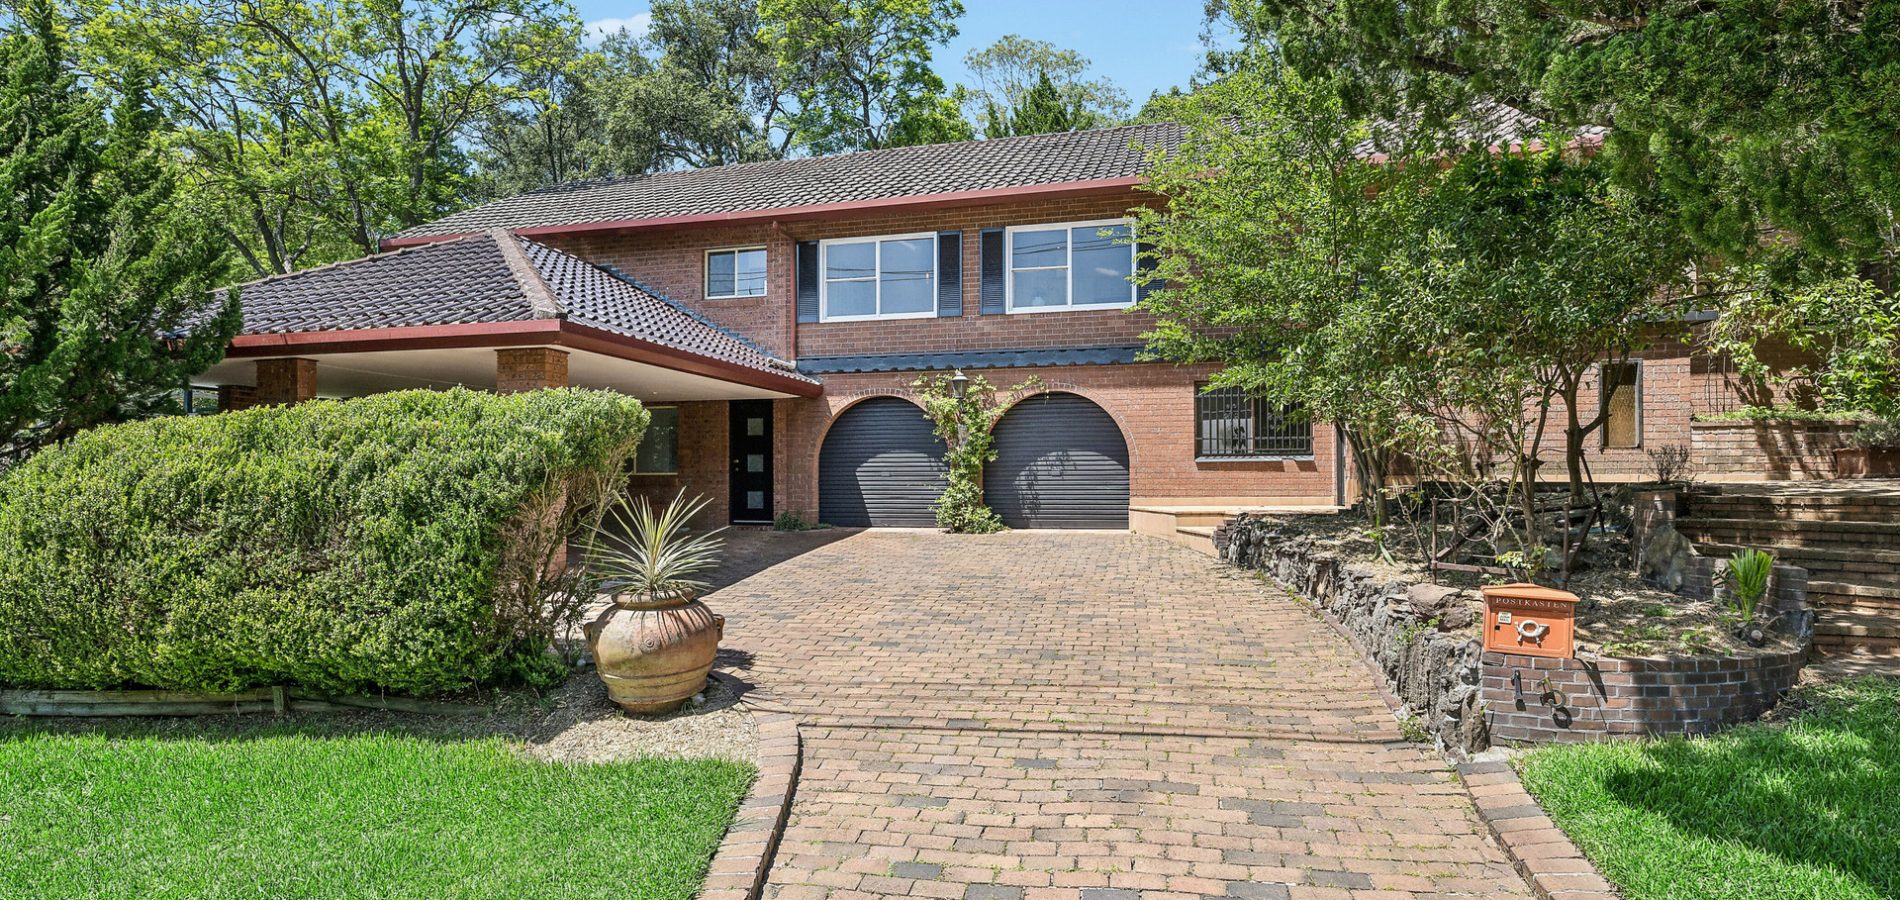
Recently sold properties across the Lower Blue Mountains
Find out how much your home could be worth?
Find out the value of your property and see comparable sales, suburb performances and more. It takes seconds.
Latest Community News
John McGrath – What to expect in our changing market
John McGrath – What to expect in our changing market
John McGrath – Regional Market Update: country homes continue to attract city buyers
John McGrath – Regional Market Update: country homes continue to attract city buyers

John McGrath – Homeowners’ strong position will help in softer conditions
John McGrath – Homeowners’ strong position will help in softer conditions
Properties for sale with McGrath across the Lower Blue Mountains
Properties for rent with McGrath across the Lower Blue Mountains

Sell With Us
McGrath Do So Much More than
Sell Your Property
The McGrath Sales System is a bespoke approach to selling real estate. It enables our agents to provide the information and insights you need to make informed decisions.
Our aim is to deliver a seamless experience and achieve a premium price.

Find An Agent
McGrath | Leading Experts Across the Lower Blue Mountains and Surrounds
From local agents and property managers to home loan brokers, McGrath is here to help. With expert local knowledge, our team of dedicated real estate agents strive to ensure you get the best result.

Manage With McGrath
Maximise Your Investment
Potential
For over 30 years we have been refining the McGrath Leasing System to ensure we provide our clients with a distinct advantage.
Whether you are a first-time investor, multiple owner, or renting out your family home, our team is committed to delivering the best possible result.